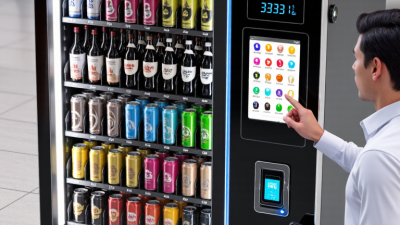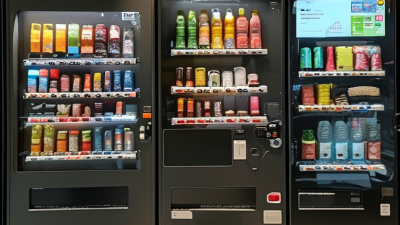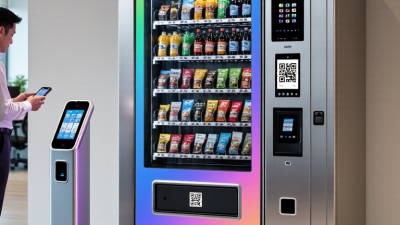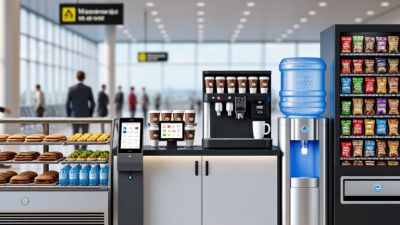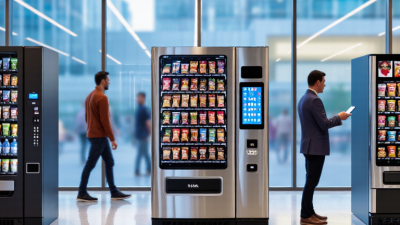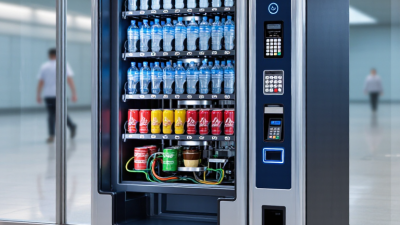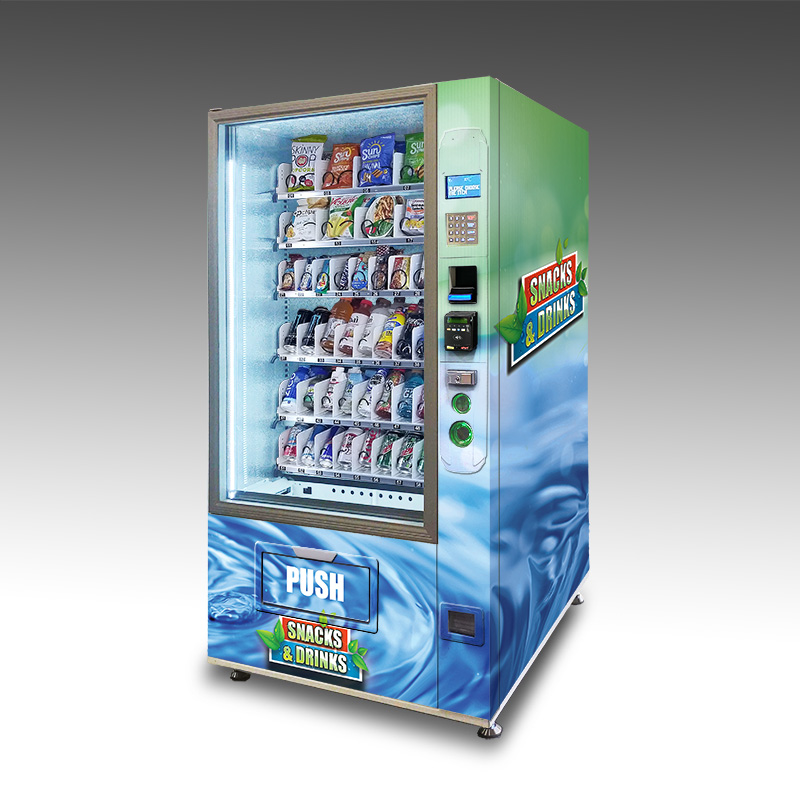
What is the best digital vending machine in 2026? The answer depends on what it must sell, where it operates, and how reliably it serves customers. A refrigerated machine in a busy office needs different features from a compact snack unit in a school or workplace. The screen matters, but so do payment options, stock visibility, energy use, and service access. A polished interface alone proves little.
Industry data helps explain the shift. Grand View Research estimated the global vending machine market at USD 21.3 billion in 2023, with projected growth of 10.7% annually from 2024 to 2030. That figure covers vending machines broadly, not digital models alone. Worldpay’s Global Payments Report 2024 found that digital wallets represented about 50% of global e-commerce value and 30% of in-person payment value in 2023. For operators, those figures make cashless acceptance worth checking—not assuming.
This guide compares digital vending machine options through practical criteria: payment flexibility, remote inventory monitoring, product capacity, reliability, and total operating cost. It also considers the people who refill and maintain each unit. Small details count: Can a technician reach the refrigeration components quickly? Does the machine flag low stock before a popular item disappears? These questions can matter more than a dramatic touchscreen. No model is best for every location, and published market forecasts cannot predict performance at one specific site. The comparison that follows aims to make the trade-offs clearer, while leaving room for a less glamorous truth: good equipment still needs good upkeep.
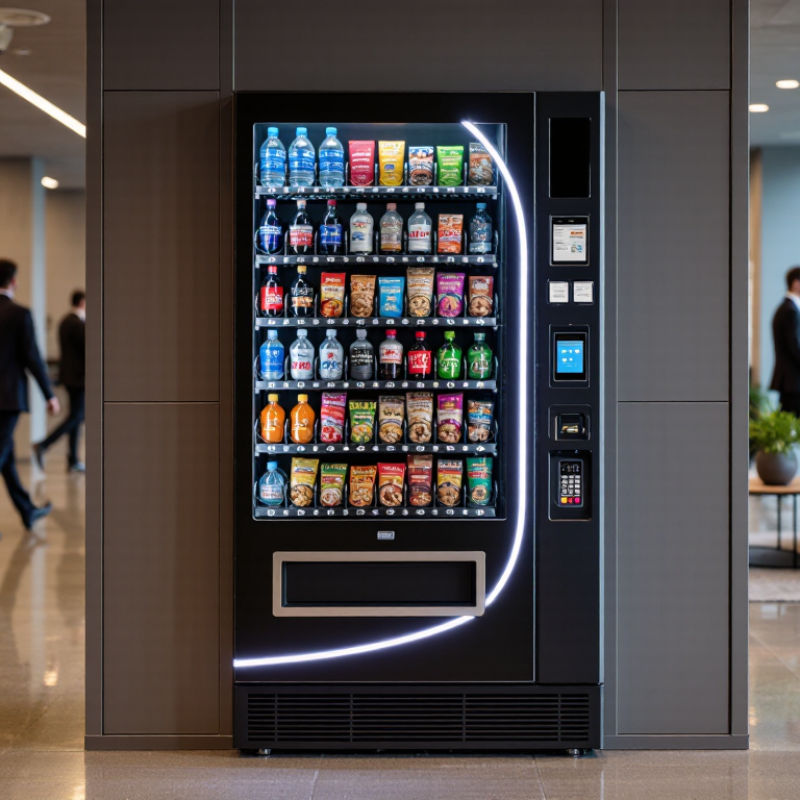
Digital vending is not simply a machine with a touchscreen. It combines automated dispensing with cashless payments, connected inventory tracking, and remote performance data. A customer can tap a card, choose a chilled drink, and collect it in seconds. The operator may see stock alerts without opening the machine. Small details matter.
Mordor Intelligence estimates the global vending machine market at about $21.5 billion in 2024. Grand View Research places the market at $21.3 billion in 2023, illustrating how estimates differ by source and scope. These figures describe vending machines broadly, not a universally defined digital-vending category. Some reports count hardware; others may include connected services or related retail formats. That boundary is fuzzy.
The number is useful context, not a precise measure of digital machines alone. For buyers, the practical test is whether payment options, remote monitoring, and restocking data improve service at a specific site. A machine in a busy lobby needs different features from one in a quiet workplace.
Technology helps, but it does not fix poor product choices or unreliable refills. Real operations can be messier than market charts suggest.
A digital vending machine should be judged against real operating needs, not a touchscreen alone. NAMA’s 2023 State of the Industry report estimates the U.S. convenience services industry at $26.6 billion. That figure covers vending, micro markets, office coffee, and related services; it is not vending-machine revenue by itself. This distinction matters when comparing a machine’s features with the wider industry benchmark.
Look for reliable cashless payments, remote inventory monitoring, and clear sales reports. These tools can help operators spot empty drink rows before a lunch rush and reduce unnecessary site visits. Temperature alerts and accessible controls also matter, especially in busy locations. But a dashboard cannot fix poor product choices or slow restocking. It helps expose the problem. It does not solve everything. NAMA’s benchmark provides useful market context, though operators still need to compare equipment costs, service requirements, and sales at their own sites.
Tips: Ask for a live demonstration of payment, stock alerts, and reporting. Check how quickly a technician can respond. A machine may look impressive, yet prove awkward to refill. Test it in the space where it will actually operate.
The best digital vending machine in 2026 should make payment simple, monitoring useful, and security verifiable. The 2024 Micropayment Trends Report recorded cashless payments at 71% of vending transactions in 2023, up from 67% in 2022. That shift supports contactless cards and mobile wallets, but it does not make cash irrelevant. The Federal Reserve’s 2024 Diary of Consumer Payment Choice found that cash represented 16% of U.S. payments in 2023. Keep a fallback. A declined tap should not leave a customer guessing.
Remote monitoring should show stock levels, sales, outages, and refrigeration alerts on one clear dashboard. A technician can then refill an empty snack row or investigate a temperature warning before the next visit. But dashboards can lag. Check how quickly alerts arrive and whether staff can confirm fixes. For payment security, ask how card data is protected, who manages updates, and what evidence supports PCI DSS compliance. The PCI Security Standards Council published PCI DSS version 4.0.1 in June 2024. Choose equipment that limits card-data handling and supports applicable controls; encryption alone is not proof of compliance. A polished screen means little if its security responsibilities remain unclear.
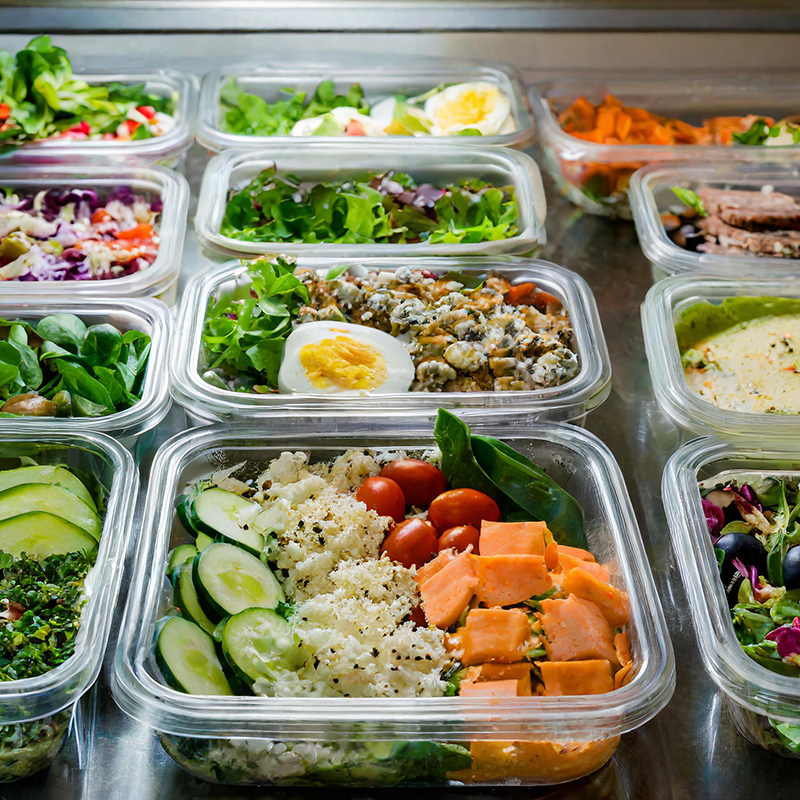
The best machine depends on what people buy, where they buy it, and how quickly stock moves. For bottled drinks or fresh meals, choose a refrigerated unit with reliable temperature monitoring. For packaged snacks, a compact shelf-based machine may be easier to refill and maintain. Fit matters more. Check product dimensions, payment options, and access for restocking before choosing a model.
Location changes the decision. A busy office lobby may support a larger machine with several product categories. A small clinic waiting area may need a quieter unit with a narrow footprint and simple payment steps. Outdoors, weather protection and stable connectivity matter. Measure the doorway and service route, too. A machine that cannot be moved into place is a costly mistake.
Use sales data to match capacity with inventory turnover. Fast-selling drinks need enough space to avoid empty slots during peak hours. Slow-moving items can tie up cash and expire, especially in warm locations. Digital stock alerts help, but they are not perfect. Sensors may miss a stuck product or misread a refill. Review sales and physical counts together, then adjust the product mix every few weeks. A modest machine with accurate restocking can outperform a larger one that is often half empty.
Rank 2026 digital vending options by five-year total cost, not sticker price. Include payment hardware, connectivity, software, transaction fees, service visits, and replacement parts. NAMA’s 2023 State of Convenience Services report estimated U.S. convenience-services sales at $26.6 billion in 2022. That scale is useful context, not a machine-level profit forecast. Check the logs.
Score reliability using documented uptime, median repair time, parts lead times, and service coverage for your exact region. Request anonymized records from comparable locations. A confident sales claim is not proof. The Federal Reserve’s 2024 Diary of Consumer Payment Choice found cash represented 16% of U.S. payments in 2023. This is not vending-specific, but it supports offering cashless payment alongside cash. Not a promise.
Rank analytics by usefulness: hourly sales, stockouts, refunds, and gross margin per selection should export cleanly. Test a sample dashboard against one real operating week before signing. Weight cost 40%, reliability 35%, and analytics 25%, then adjust for foot traffic and service distance. I would not trust a perfect scorecard; local conditions can overturn it.
| Rank | Machine configuration | Indicative upfront cost (USD) | Estimated 3-year total cost (USD) | Reliability considerations | Sales analytics | Best fit |
|---|---|---|---|---|---|---|
| 1 | Standard refrigerated vending machine with telemetry | $5,000–$10,000 | $9,000–$19,000 | Mature, mechanically straightforward format. Routine cleaning, refrigeration checks, and planned restocking remain important. | Typically supports remote inventory, sales-by-item reporting, machine status alerts, and basic transaction summaries. | Most balanced choice for established snack and drink locations. |
| 2 | Smart cooler with access control and item-level tracking | $6,000–$12,000 | $11,000–$23,000 | Fewer dispensing mechanisms than a traditional coil machine, but depends on refrigeration, door locks, cameras or sensors, and network connectivity. | Can provide basket-level purchase records, time-of-day trends, and near-real-time stock estimates; accuracy depends on the sensing system and product setup. | Best for fresh food, varied product sizes, and workplaces with controlled access. |
| 3 | Touchscreen vending machine with cashless payment and cloud reporting | $7,000–$14,000 | $13,000–$27,000 | More software and connectivity components create additional maintenance needs. Confirm offline payment behavior and remote support arrangements. | Often includes item-level sales, pricing and promotion reports, payment-channel summaries, and remote configuration. | Best for sites that value a polished customer interface and flexible merchandising. |
| 4 | Compact countertop or micro-market kiosk setup | $2,000–$7,000 | $5,000–$15,000 | Lower equipment cost, but performance depends on the payment terminal, product display, and the security of the unattended area. | Payment reports can show transaction totals and product-level sales when checkout and inventory records are configured together. | Best for small offices, limited space, and lower-volume locations. |
| 5 | Specialty machine with custom dispensing or temperature control | $10,000–$25,000+ | $18,000–$45,000+ | Specialized components may require dedicated parts, technician training, and longer service lead times. Validate local repair coverage before purchase. | Analytics vary widely; verify that reports cover item-level sales, stock status, refunds, and machine faults rather than only payment totals. | Best when the product requires a specialized format or operating environment. |
Cost figures are indicative USD planning ranges, not vendor quotes or independently verified market averages. Three-year totals include estimated equipment, connectivity or software, payment-processing charges, routine maintenance, and ordinary operating costs; they exclude product inventory, sales tax, financing, site rent, and labor for restocking. Actual costs depend on capacity, location, service terms, transaction volume, and payment fees. Reliability is described qualitatively because comparable, independently audited uptime data is not consistently published across machine configurations. Confirm warranty coverage, service response times, data exports, and analytics features in a written proposal.